Today, many assets across multiple industries are becoming more instrumented and connected to enterprise platforms to provide additional insight into their health and operation. IDC estimates that Internet of Things (IoT) investment will reach $1.12 trillion in 2023. One important area for many industrial organizations that are focused in using IoTdata is to improve predictive maintenance and increased reliability on these assets.
Analytics play a critical role, but that is only one piece to the puzzle. In my experience, an organization needs to consider three key phases in order to realize this value: develop, deploy and operationalize. The following is a high-level framework to outline each phase and an industry relevant example to demonstrate of how this can be accomplished using SAS® Viya® and SAS® Event Stream Processing.
Foundation of approach: The analytics life cycle
The analytics life cycle is comprised of three phases:
- Data – ingest and prepare various data sets into an analytically ready dataset
- Discovery – explore, visualize, build and validate models on data to solve the business problem
- Deployment – operationalize these analytic models to realize business value
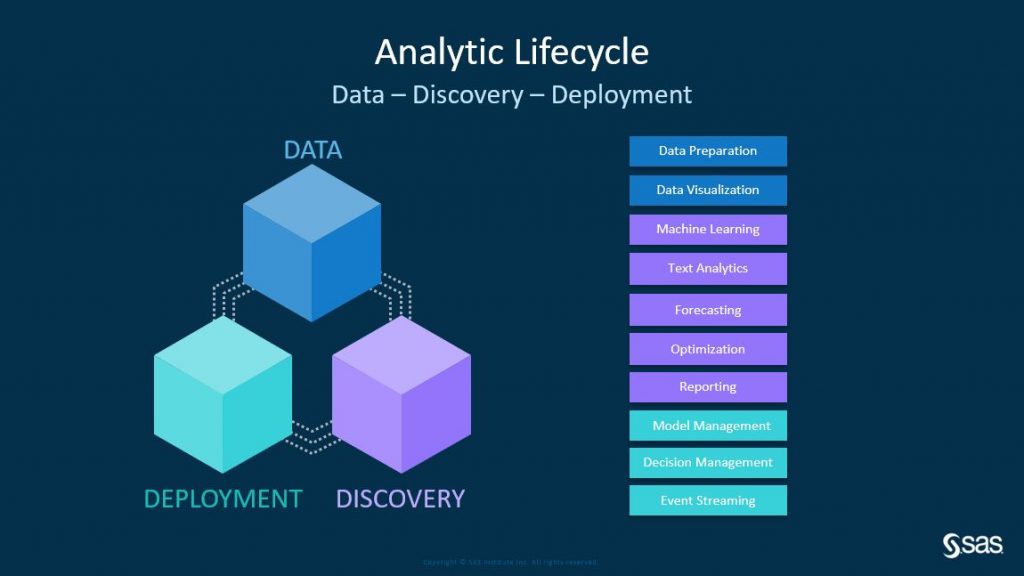
The analytics life cycle is meant to be a continuous and iterative process as new learnings and requirements are identified. For this predictive maintenance example, the Analytics for IoT offering at SAS would be the preferred analytics solution. It combines machine learning analytics for high-frequency time series data, as well as underlying capabilities to streamline data ingestion and preparation.
Phase 1: Develop
Once asset data has been collected and prepared for analysis, the next step in enabling predictive maintenance is to create and validate analytics that provide context on the state of the asset and to determine when an action should take place. This can be done using multiple analytic techniques, such as Threshold Based Analytics, Pattern Matching, Supervised/Unsupervised Machine Learning, etc. In general, these analytics can be broken down into 3 categories:
- Feature Calculations (ex. Threshold Base, Western Electric)
- In-stream training and in-stream scoring (ex. Clustering methods, Regression)
- Out-of-stream training and in-stream scoring (ex. Gradient Boosting, Decision Trees)
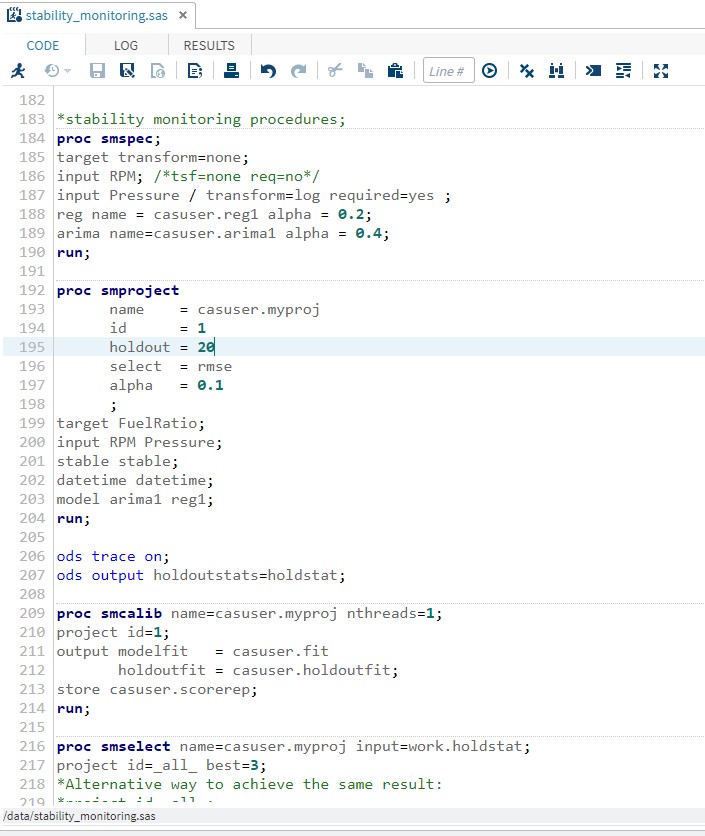
For this example, one key analytic technique is Stability Monitoring which falls into the 3rd category. These models provide an intelligent way to track the on-going health of an asset where the metric of interest is checked against the boundary conditions generated by the model. This requires training the model on historical data across various operating modes where the asset is mostly considered healthy and normal. To create a Stability Monitoring model, many procedures within the SAS® Viya Visual Forecasting Procedures (SMSPEC, SMCASLIB, SMSELECT, SMSCORE) can be used with a training data set within SAS Studio. The model can be of type Mean, Regression, or ARIMA. In the Figure below, this image has a partial view of the SAS Code for Stability Monitoring Modeling.
Once a model is selected and validated against a test data set, the model can then be registered in SAS® Model Manager. Registering a model in a centralized repository is a critical step in the process for a variety of reasons, including governance, security, lineage, monitoring, and deploying models. This is necessary for high-valued assets such as analytic models that can be critical to business processes. Model Manager streamlines this process and enables the security and lineage required to maximize model performance.
Phase 2: Deploy
Once you have developed and validated a model that is performing as expected, it needs to be using the data generating from your assets. Typically, industrial assets can produce a tremendous amount of data and require minimal latency to enable a value-added action to be taken.
For this example, SAS® Event Stream Processing is used to execute analytics using the streaming data to meet these objectives. For other business use cases and requirements, SAS provides a variety of model deployment options including in-database, in-Hadoop, ad hoc, batch, etc. This flexibility of the various options is useful when handling various business use-cases with your requirements.
SAS Event Stream Processing provides a flexible and adaptable analytic engine that can be deployed along any point of an enterprise deployment architecture. The analytic engine can publish/subscribe to more than 300 endpoints and can execute anywhere from an IoT Edge device next to an asset to a distributed cloud environment. In addition, SAS Event Stream Processing provides streamlined integration with models registered in SAS Model Manager.
This is a differentiator for a couple of reasons. As event stream processing is deployed, the model selected from SAS Model Manager is retrieved and deployed as part of the analytics package. In addition, any changes made to the model registered in SAS Model Manager will provide notifications that a change has been made. This provides lineage and governance for where and how the models are being used.
Here is what an ESP analytic would contain in an industrial setting"
- Data ingestion - SAS Event Stream Processing would connect to a data source such as OPC-UA, PI Historian, or a message bus technology (e.g., . MQTT) using standard ESP connectors.
- Data pre-processing - Once the data is ingested, pre-processing of the data can be done such as filtering, transposing and aggregating using native ESP functionality.
- Model scoring - The prepared data is scored using the referenced model from SAS Model Manager.
- Escalated alerts – After model scoring, the analytics can determine what alerts should be escalated for further processing. This alert can be sent in a variety of ways depending on business requirements … e-mail notification, SMS, external data system, etc.
This approach uses standard processes for deployment to ensure that meets the correct quality and standards for analytics.
Phase 3: Operationalize
At this point, the streaming analytics along with the analytic model has been deployed against the live, in-motion data from an industrial asset. However, no value is realized until an action is taken as a result of these analytics. In an ideal scenario, automated actions can take place if the analytic was able to provide some detectability with zero false positives and prescriptive instructions of the action to take place. From a journey of maturity for predictive maintenance, this is the end state where organizations aim to be. Typically, multiple people are involved in the process and need be able to review these alerts to determine what/if any action needs to be taken.
The decision support process implemented by an organization is critical in ensuring that value is realized. For complex assets and their associated alerts, multiple people may be involved at various steps in the process that have their own requirements to provide their inputs. As an alert is generated, questions need to address what a person needs to determine next steps along this decision support process. Questions may include:
- What data is needed? This can include analytic results, historical time-series data, asset data, etc.
- What format does the data need to be presented for easy consumption?
- How would the person consume the information? Separate visualization, existing systems, etc.
Each organization has their own needs and requirements to enable their people to consume these alerts and analytic outputs. The delivery of alerts and data for an organization should align to the tools and interfaces they use to drive their business decision process.
SAS provides the flexibility to integrate with existing systems and platforms with native data integrations, open APIs, etc. For industrial organizations, examples of this include a human machine interface (HMI) for operators and enterprise asset maintenance applications. This is a critical piece as the analytical outputs may need to be delivered to multiple downstream systems such as maintenance workflows, time-series databases, alarm management, etc.
In cases where existing investments have not yet been made or business systems lack the capability to surface new insights, products such as SAS® Viya® could be used to surface and manage this information. Regardless of the end-user system, business value is only realized when actions are taken from the analytic insights that would not have otherwise been taken.
Conclusion
This high-level framework is how an organization can realize value in enabling predictive maintenance with their connected assets. One important theme that was highlighted is to have flexibility and adaptability in the framework used to solve a variety of business needs. With connected assets, there can be significant variation from various equipment designs, connectivity, sensing packages, operational profiles, etc. It is not a one-size-fits-all approach where you can universally apply a single analytical technique to solve all the business challenges. In addition, this framework highlights the initial creation and operationalizing of an analytical model. Over time, monitoring the performance of the analytical model is critical because asset operations may change, equipment may degrade and business requirements change. If no action is taken to address a degraded analytic model, the value realized will also diminish.
To learn more about the processes used to create, update, deploy and operationalize the analytic strategies discussed in here, please check out the presentation Enabling Real-Time Stability Monitoring Models using SAS® Viya® and SAS® Event Stream Processing.